Quantifying Promotion Impact: A Marketing Mix Modelling Deep Dive into Woolworths, Coles, and IGA
Introduction: The Australian Grocery Battlefield
In the fast-paced world of Australian Fast-Moving Consumer Goods (FMCG), three retail titans dominate the landscape: Woolworths, Coles, and the independently-owned network of IGA. For brands fighting for shelf space and consumer attention, these channels are not just points of sale; they are the primary battlegrounds. Success hinges on a complex dance of brand building, media investment, and crucially, strategic promotional activity.
Consider a leading FMCG brand with a diverse portfolio of salad sauces and pastes. Their products are a staple in households nationwide, found in the aisles of all three major retailers. They invest heavily in media—from Cinema and OOH to Metro TV, Digital, and Paid Social. They even track competitor activity via Nielsen AQX data. But a persistent, critical question remains: "How are our promotions at Woolworths, Coles, and IGA truly performing?"
The assumption is that promotions drive sales. But in today's data-driven environment, "assumption" is not enough. Brand and product managers need quantifiable answers:
- What type of promotions work best?
- Which retail network (Woolworths, Coles, or IGA) delivers the best performance?
- Precisely how much sales volume is directly attributable to these activities?
Answering these questions requires moving beyond gut feeling and into the realm of econometric modelling. This is where Marketing Mix Modelling (MMM) becomes an indispensable tool. This article focuses on the critical, often-overlooked first step of any promotion-focused MMM: the complex task of transforming messy, grid-based promotion plans into a clean, model-ready format.

The Project: A Holistic View of Salad Sauce Sales Drivers
Our engagement with this FMCG brand was comprehensive. The goal was to build a robust Marketing Mix Model that could decipher the sales drivers for their salad sauce and paste products. The model needed to account for a wide array of variables:
- Media Activity: Measuring the effectiveness of their own channels: Cinema, OOH, Metro TV, Regional TV, Digital, Metro Radio, and Paid Social.
- Competitive Activity: Factoring in the pressure from competitor advertising spend on Competitor Metro TV, Competitor Regional TV, and Competitor Metro Radio, sourced from Nielsen AQX.
- External Factors: Incorporating broader market influences like the Consumer Price Index (CPI), school holidays, and public holidays.
- Consumer Insights: A key piece of market research revealed a significant behavioural pattern: mothers often purchase these sauces and pastes as a convenient lunchbox solution for their children, leading to predictable spikes in sales before school terms.
But at the heart of this analysis were the promotions. The brand knew that discounting and featured offers in catalogues were powerful, but without quantification, they were flying blind on optimization.
The Promotion Data Challenge: From Strategic Grids to Modelling Chaos
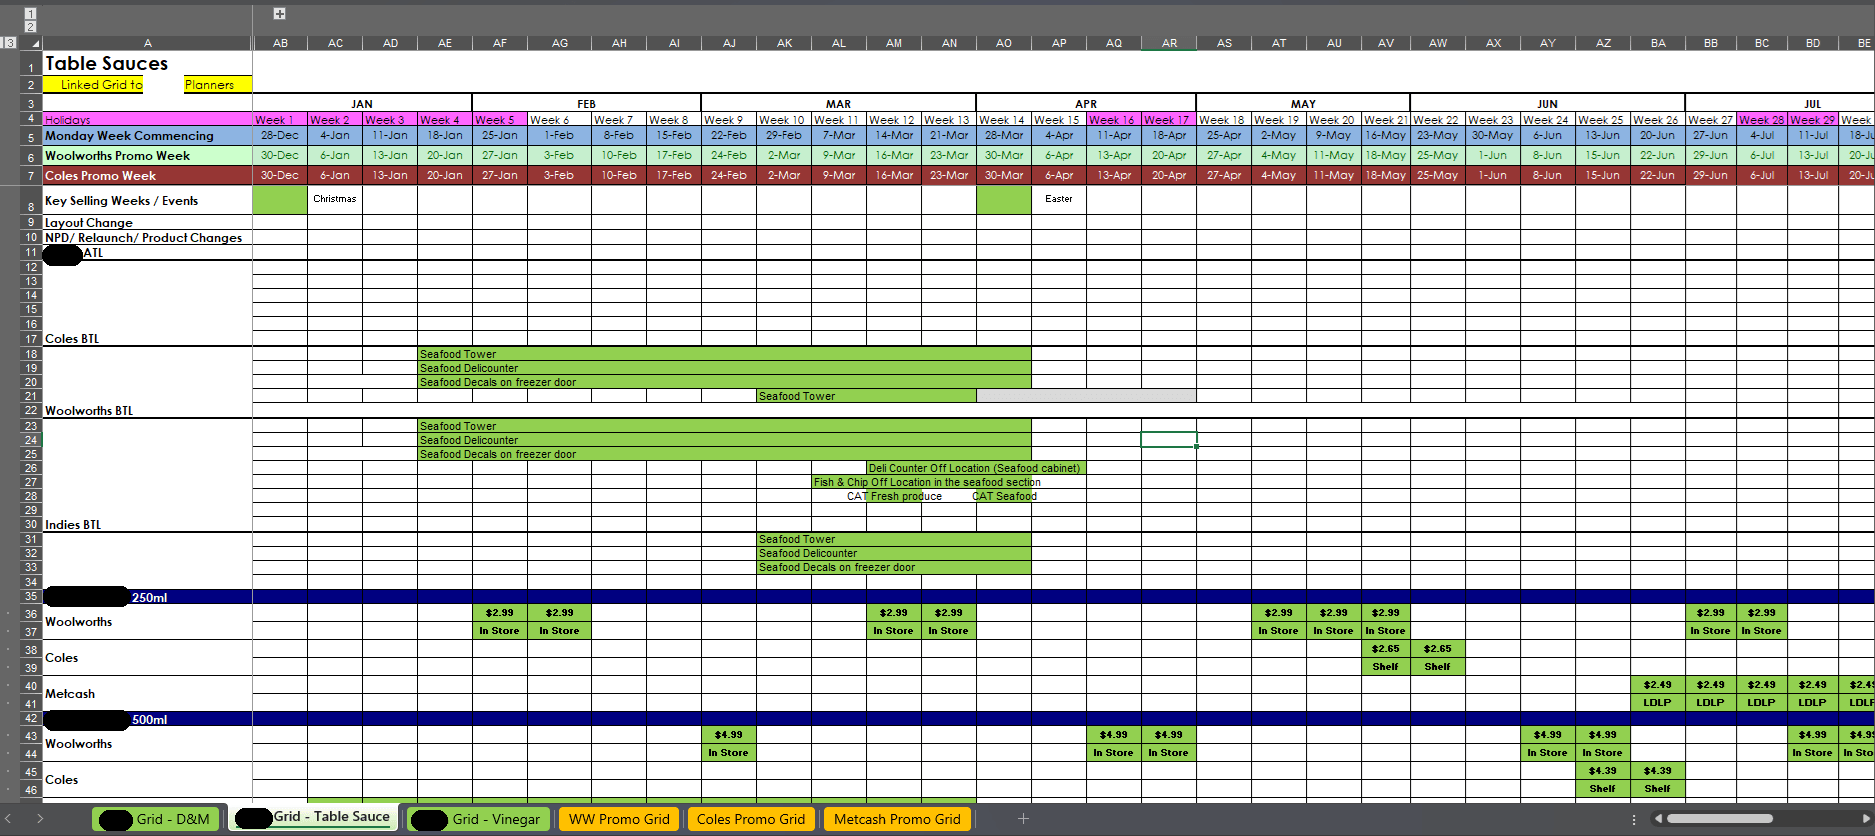
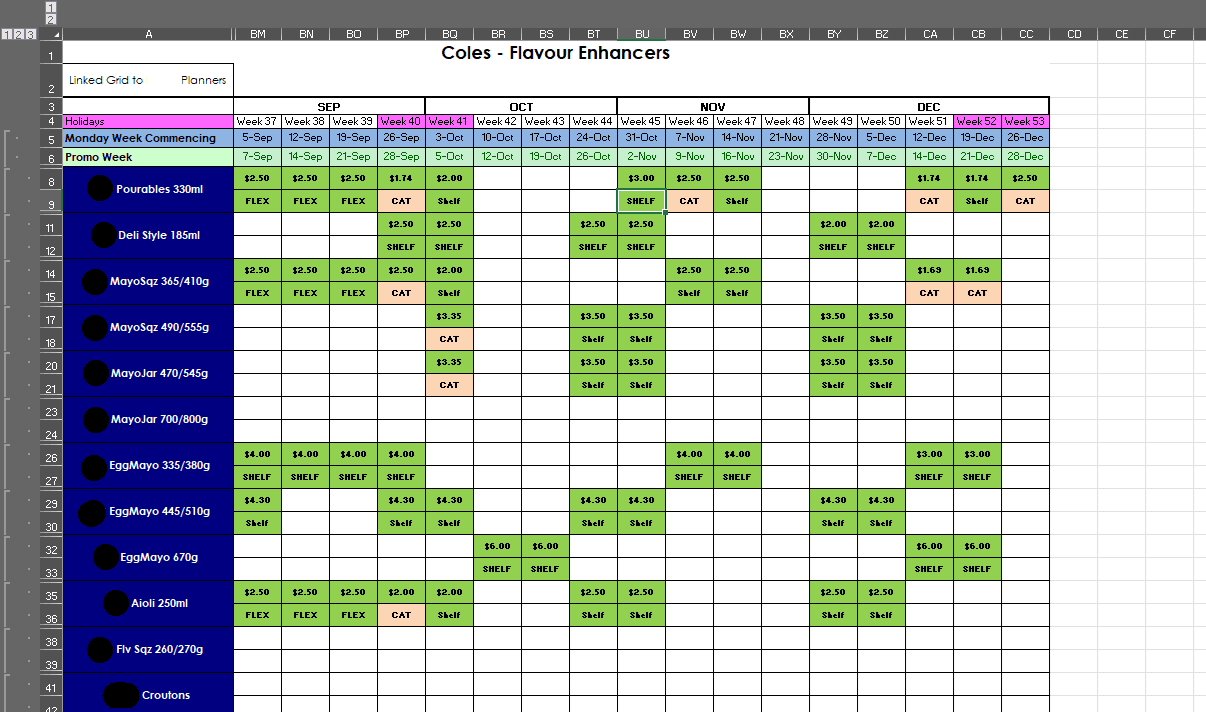
The brand's internal trade marketing team was highly organized. Their promotional calendar was meticulously planned using a series of complex Microsoft Excel spreadsheets. These documents were the master plan, but they were structured for human planning, not machine reading.
Imagine a grid:
- The Y-Axis listed every single Stock Keeping Unit (SKU) – every variant of every salad sauce and paste.
- The X-Axis was a timeline, broken down by week.
- At the intersection of each SKU and each week was a cell detailing the promotion. This could be: "30% Off," "Was $4.50 / Now $3.00," "Buy One Get One Free," "Woolworths Half-Price Down," "Coles Collectible Offer," or "IGA Special Buy."
This grid format is perfect for a planner. It provides an at-a-glance view of what is happening, where, and when. However, for Marketing Mix Modelling, this structure is virtually unusable.


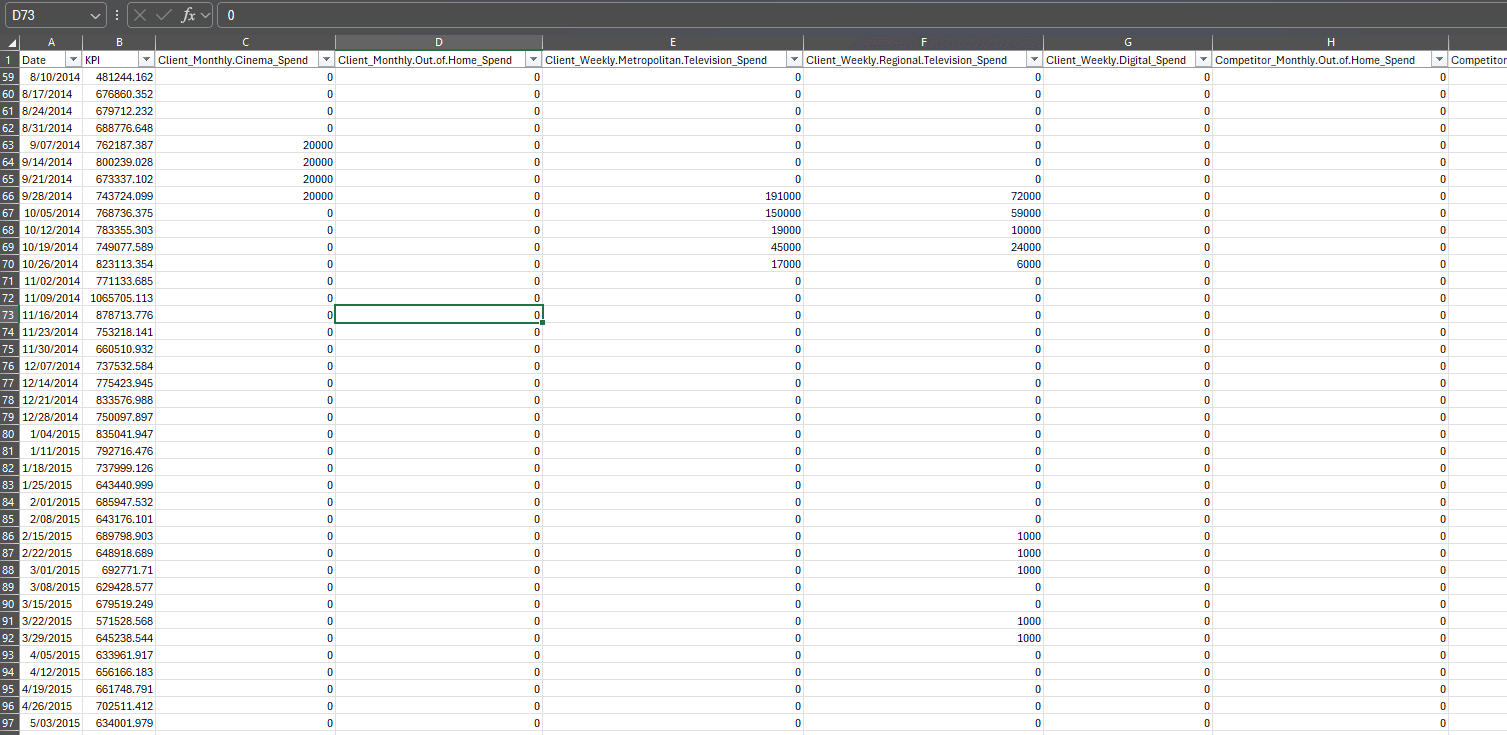
MMM requires a "wide-format" table. In this format:
- Each row represents a single time period (e.g., one week).
- Each column represents a single, distinct variable.
- The Key Performance Indicator (KPI) – in this case, sales volume of salad sauces – is a single, aligned column.
The promotion grid, with its multi-dimensional, cross-tabulated layout, was the antithesis of this. To build an accurate model, we needed to convert hundreds of layered grid cells into clean, binary (on/off) or weighted (discount depth) columns for each major promotion type and retailer combination.

The Solution: Automating the Data Translation for MMM Success
Manually transposing this data would be a Herculean task. For a single product, it might take a junior analyst several hours. For a entire portfolio across three major retailers and two years of weekly data, we were looking at weeks of tedious, error-prone manual labour. This was the industry norm a decade ago—a major bottleneck that delayed insights and increased costs.
However, at More Than Data, we had already solved this problem. Even tracing back to 2017-2018, well before the advent of advanced AI like ChatGPT, we had developed proprietary automation software specifically designed for this task.
Our software was engineered to:
- Scan and Ingest: Read the native Excel promotion grid files directly.
- Digest and Classify: Use natural language processing (NLP) rules to identify and categorize the text in each cell. It could distinguish a "20% Off" promotion from a "Multi-Buy" offer and correctly attribute it to the correct retailer (Woolworths, Coles, or IGA).
- Restructure and Reformat: Translate these categorized promotions into the pristine, wide-format table required for MMM. It created logical variables like "Promo_Woolworths_20%Discount" or "Promo_Coles_BuyOneGetOneFree".
What would have taken a team days to complete manually was accomplished with flawless accuracy in a matter of minutes. This automation wasn't just a convenience; it was a game-changer. It eliminated human error, freed up skilled analysts for higher-value tasks like interpretation and strategy, and drastically accelerated the entire modelling timeline.

Measuring the Impact: What the MMM Revealed
With the promotion data perfectly formatted and integrated with media, economic, and seasonal variables, we built a powerful and highly accurate Marketing Mix Model. The results provided the clear, quantifiable answers the brand desperately needed.
The model successfully isolated the impact of promotions from all other factors. It could distinguish the sales uplift from a Metro TV campaign from the spike caused by a half-price offer at Coles. It could even see how a competitor's radio blitz (Competitor Metro Radio) dampened their own baseline sales.
Crucially, the findings on promotions were revealing:
What kind of promotions work?
The model quantified that deep discounts (e.g., "50% Off") generated a higher volume lift per promotion week than low discounts. However, when factoring in profit margin, the optimal strategy was a mix of moderate discounts and high-visibility catalogue features.
Which retail network performed better?
The sales uplift from a dollar-equivalent promotion was markedly different across retailers. The model might show that a $1-off promotion at Woolworths drove a 15% volume lift, while the same offer at IGA drove a 22% lift, revealing differences in shopper responsiveness and trade-area dynamics. This intelligence was invaluable for future trade negotiations and budget allocation.
How much sales are driven by promotions?
The model provided the definitive number: over the analysis period, X% of total salad sauce sales volume was directly attributable to promotional activity. This established a crucial baseline for evaluating the ROI of the multi-million dollar trade promotion budget.
From Data to Action: Presenting Insights and Driving Strategy
The project's success was cemented in the presentation of findings. We worked closely with the brand's media agency, ensuring the modelling insights were translated into actionable business recommendations.
The presentation to the advertiser wasn't just a dump of charts and coefficients. It was a strategic narrative that explained:
- Baseline vs. Incremental: How much of their sales were "always there" (baseline) vs. driven by marketing activities (incremental).
- Efficiency of Spend: The relative ROI of each media channel and each promotion type.
- Optimization Scenarios: "If you shift 10% of your budget from deep discounts at Coles to catalogue features at Woolworths, here is the projected impact on overall volume and profit."
The clarity and depth of the analysis, rooted in the rigorous data preparation, were overwhelmingly well-received. It moved the conversation from "Did our promotion work?" to "How can we optimize our promotional strategy for maximum ROI next quarter?"
In a previous deep dive, we chronicled the entire end-to-end process, from data acquisition to final insight, for this very project. For a comprehensive look at the methodology and detailed results, you can read the full case study here 👉: Leveraging Data to Optimize FMCG Sales During Key Periods: A Case Study with More Than Data.

Conclusion: The Critical Foundation of Data Preparation
The story of this salad sauce brand is a powerful reminder that in analytics, the brilliance of the model is entirely dependent on the quality and structure of the data fed into it. The most sophisticated Marketing Mix Modelling algorithm is useless if the input data—especially complex promotion grids from Woolworths, Coles, and IGA—is not translated into a model-ready format.
The lesson for FMCG brands is clear: investing in the right data infrastructure and automation processes is not an IT expense; it is a strategic imperative. By mastering the art of data translation, brands can unlock a true understanding of their marketing 4P's (particularly Promotion), empowering them to make smarter investments, win at the point of sale, and ultimately, drive sustainable growth in the competitive Australian grocery market.
While modern AI tools like ChatGPT can now assist with such tasks, the principle remains timeless: the path to insight begins long before the model is run. It begins with the meticulous, often unglamorous, work of getting the data right.
