Marketing Mix Modelling Meets MTA: A New Approach to Customer Journey Mapping
Introduction: Beyond the Magic Box
“What if every customer decision could be traced back to a single ad?”
That has been the implicit promise of marketing attribution for years. From the heyday of cookie-based Multi-Touch Attribution (MTA) to the top-line clarity of Marketing Mix Modelling (MMM), marketers have long sought a reliable way to map the path from media investment to customer purchase.
Yet in 2025, the marketing measurement world looks very different. Cookies are gone. Privacy laws are tightening. The gap between offline and online journeys has widened. And still, the age-old question remains: How do we truly understand the customer journey across channels, both Above-the-Line (ATL) and Below-the-Line (BTL)?
At More Than Data, we believe a breakthrough is possible. By combining the best of MTA and MMM—and introducing a new layer of customer journey mapping—we can capture the complexity of modern media ecosystems without breaking privacy rules or relying on user-level data.
This article explains why this method matters, how it works, and what it has revealed for real-world brands.

Why Reinvent Customer Journey Mapping?
The Motivations
- MTA has fragmented. Once cookie-dependent, it now struggles to survive in a privacy-first internet. Device-level tracking is nearly impossible, and digital-only scope leaves offline media invisible.
- Offline and online must coexist. In reality, customer journeys are cross-channel. A TV ad sparks awareness. A Google search nurtures interest. An in-store promotion drives conversion. Existing attribution models rarely capture this interplay.
- Privacy laws are here to stay. GDPR in Europe, CCPA in California, and similar regulations worldwide mean user-level tracking is increasingly restricted. A measurement solution must avoid personal data while still providing actionable insights.
- Unifying strengths of MTA and MMM. MTA shows sequential paths but ignores offline. MMM includes offline but oversimplifies relationships as direct “media → sales” causality. We need a method that does both.
The Limits of MTA
Multi-Touch Attribution (MTA) maps digital interactions: impressions, clicks, and conversions. But:
- It is digital-only, blind to TV, radio, OOH, and print.
- It relies on cookies and cross-device tracking, which are fading fast.
- It can overstate online ads while undervaluing offline triggers.

The Limits of MMM
Marketing Mix Modelling (MMM) operates at the channel level, using aggregated data like media spend, impressions, and reach. It is excellent at showing correlations between media and sales. However:
- It assumes direct causality: every media variable directly impacts sales.
- It misses the sequential funnel reality: not every ad directly drives purchases.
- It aggregates data, losing the journey narrative of customers.
The Measurement Dilemma
We face a paradox:
- MTA shows the chain-style digital path but ignores offline.
- MMM covers both online and offline, but flattens everything into direct sales impacts.
With cookies gone and privacy laws stronger, user-level tracking is off the table. The only sustainable path forward is leveraging media-level data—spends, impressions, reach, clicks, views—data marketers already collect from ad platforms and offline reporting.
But how can this data be transformed into a representation of the true customer journey?

The New Method: Media Relational Network (Customer Journey Mapping)
At More Than Data, we have developed a method to bridge the gap: a customer journey mapping approach that unifies the best of MMM and MTA.
We sometimes call it the Media Relational Network.
How It Works
- Data foundation. We use media buying and tracking data—spends, impressions, clicks, reach—from both digital (Google Ads, Meta Ads, DV360, YouTube) and offline (TV, OOH, Radio, Print). This avoids user-level data, staying privacy-safe.
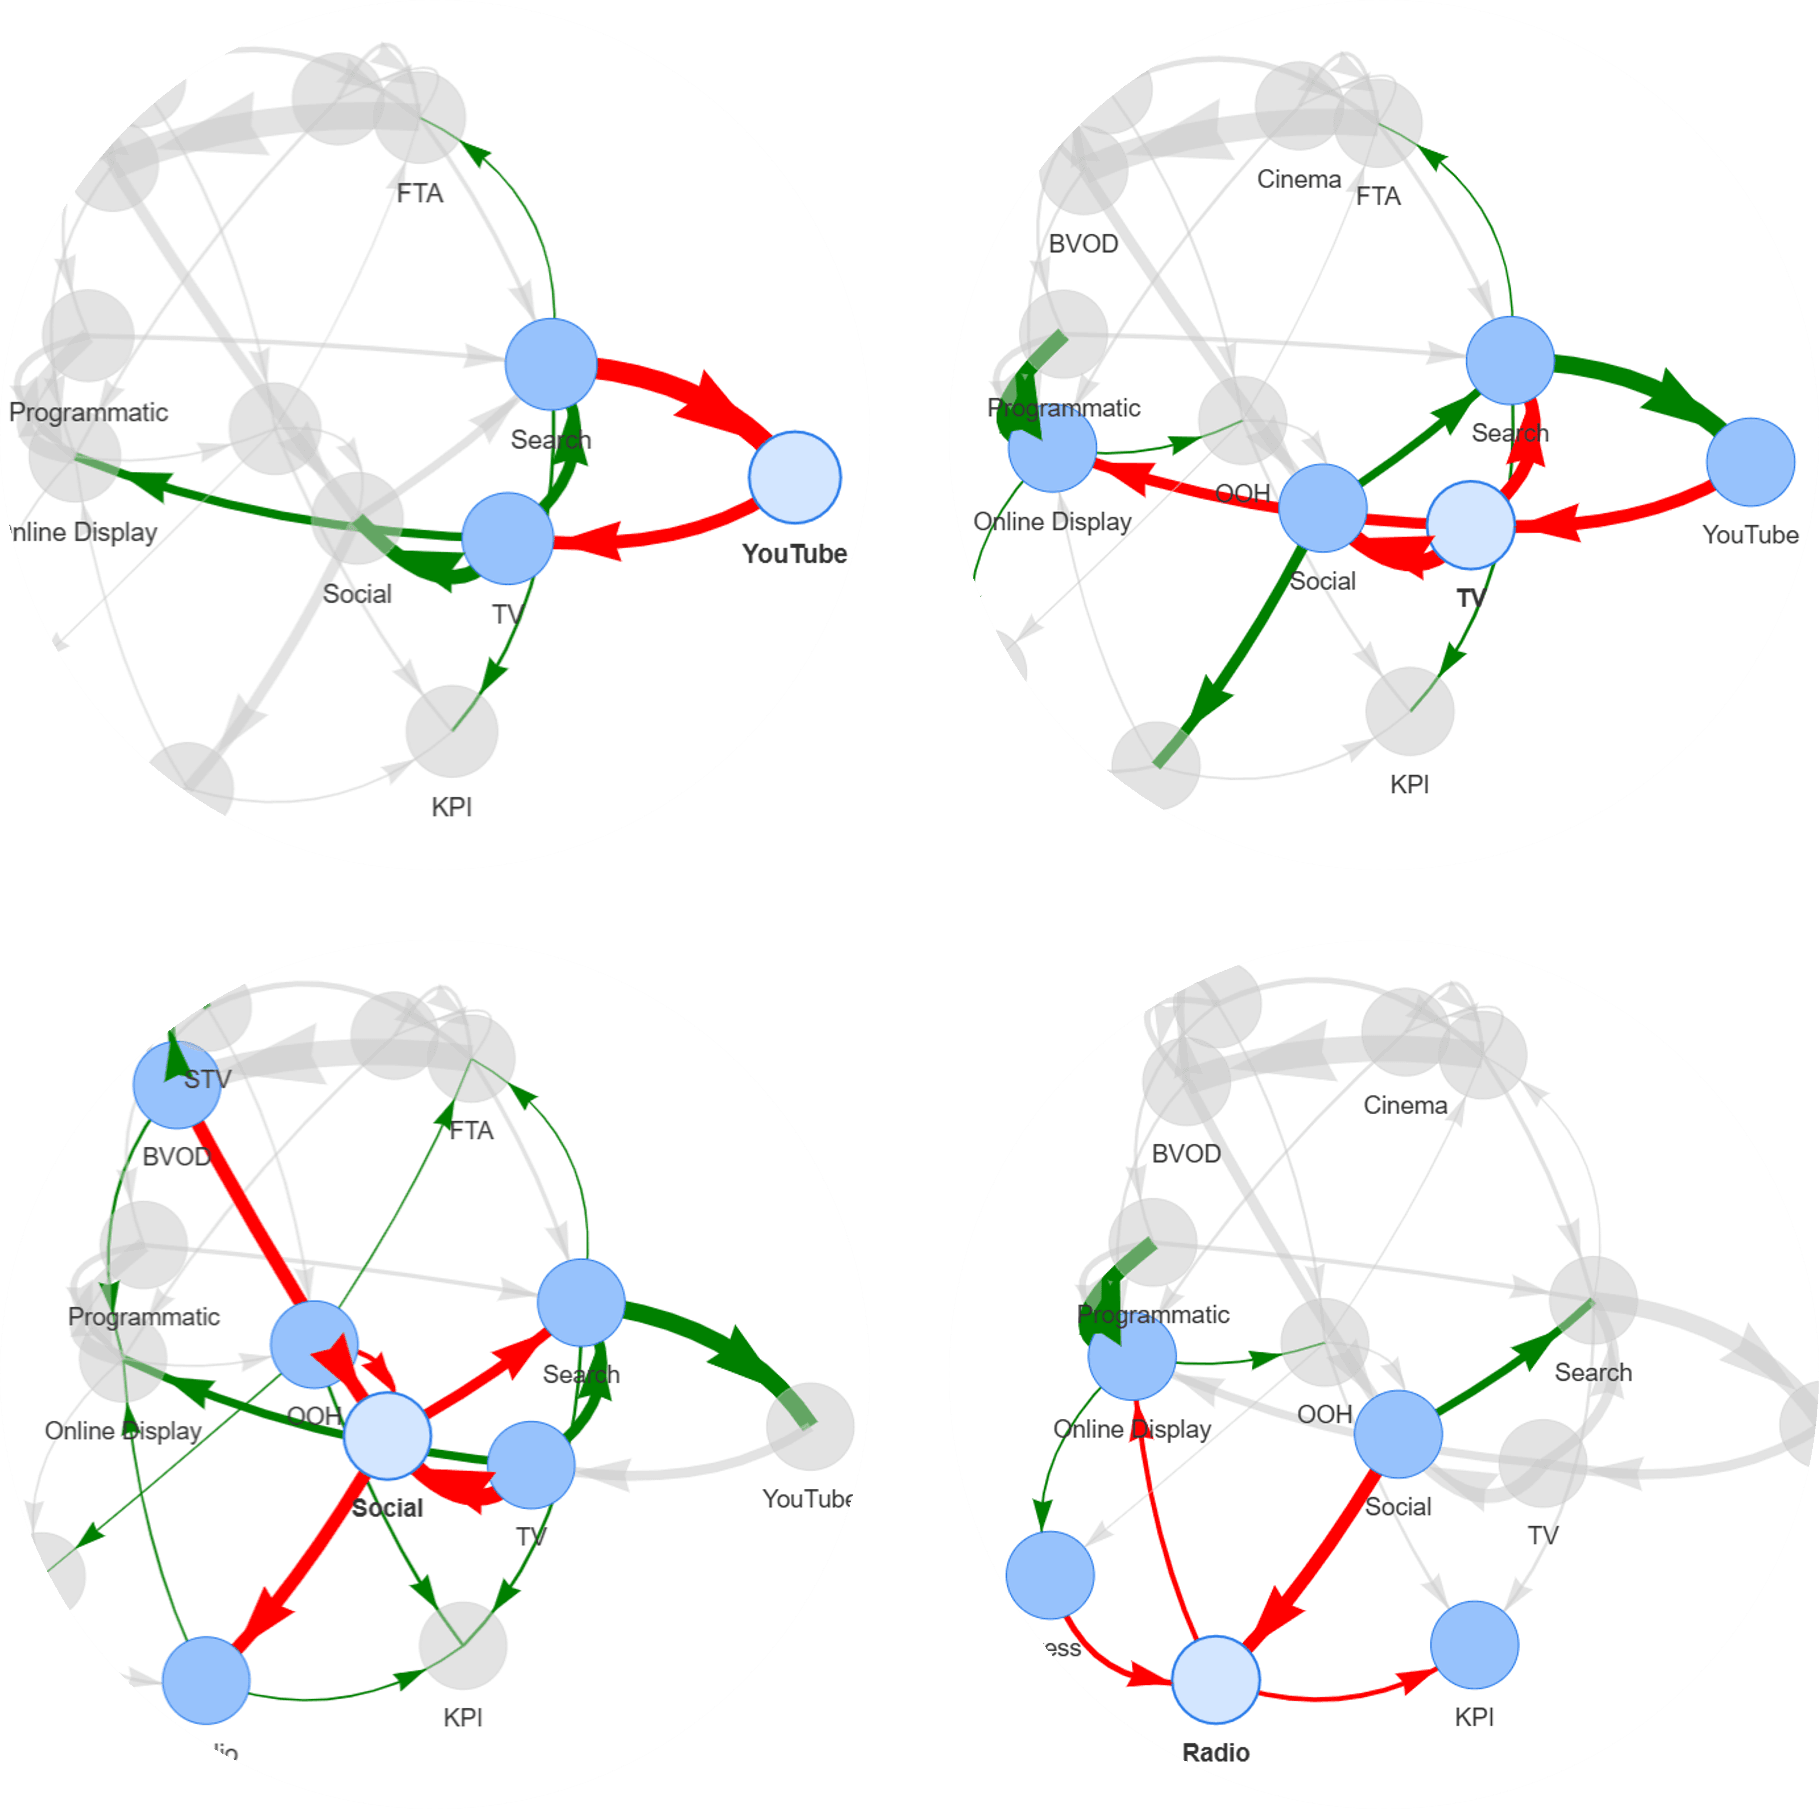
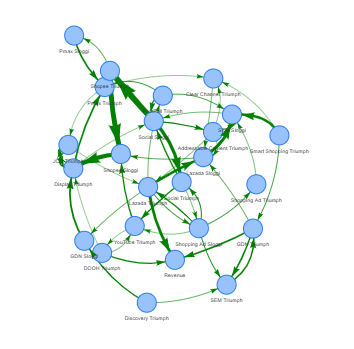
- Graph-based modelling. We apply Directed Acyclic Graphs (DAGs) to map connections between media channels. Each channel is a node. Each directional edge shows influence from one channel to another. The “muscle” of the edge shows the strength of the relationship.
- Sales linkage. Every media channel connects to sales, either directly or indirectly, through multiple pathways. This reflects the layered complexity of real-world marketing funnels.
- Validation. Connections are validated using marketer domain knowledge and experiments. While no model perfectly reflects reality, this approximation provides a credible map of how media channels interact.
Why It’s Different
- Privacy-safe: Relies on aggregate data, not user-level tracking.
- Cross-channel: Covers both online and offline touchpoints.
- Journey-based: Moves beyond “digital media → sales” to reflect inter-channel relationships.
- Flexible: Can integrate marketing 4Ps (pricing, promotions, product launches, and placement) and external factors (consumer confidence, interest rates, retail index).

Case Study: A Retail Brand’s Transformation
To bring this to life, let’s look at a real retail client with both brick-and-mortar stores and an e-commerce website. Their media mix was complex: TV ads, paid search, social campaigns, OOH placements, and seasonal promotions.
The Problem
The brand wanted to understand:
- Which channels were true sales drivers.
- How online and offline media interacted.
- Why MMM results often felt “too simple” compared to their marketing reality.
The Approach
Using our customer journey mapping method:
- We built a media relational network across all channels.
- We included marketing 4Ps (pricing, promotions, product launches) alongside competitor activity and economic indicators (consumer confidence, cash rate).
- We visualised the ecosystem: edges showed how TV influenced search, how OOH reinforced awareness before online engagement, and how digital remarketing closed the loop.
The Results
- Key media drivers identified. Not only from MMM’s direct sales lens, but also from their position within the relational network.
- Pathway clarity. The model showed, for example, that TV did not directly generate conversions, but strongly boosted branded search and social engagement, which then drove sales.
- Smarter planning. The brand could now budget with confidence—valuing channels for both their direct and indirect roles.
This was more than measurement. It was a new way of storytelling the customer journey.
The Bigger Lessons
MMM and MTA Alone Aren’t Enough
Relying on either method in isolation creates blind spots. Journeys are too complex for single-lens models.
Customer Journeys Are Multi-Layered
No channel works alone. TV may spark awareness, but search or promotions may close the deal. Models must reflect this interdependence.
Privacy Is Non-Negotiable
The end of cookies isn’t a dead end—it’s a reset. Aggregate, media-level modelling offers a way forward that respects both marketers and consumers.
Visualisation Builds Trust
By representing media ecosystems as relational networks, marketers gain a tool they can explain to executives and clients without resorting to black-box jargon.

Conclusion: Towards Unified Journey Mapping
Marketing measurement is at a turning point. MTA is weakened by cookie loss. MMM, while valuable, oversimplifies. Brands and agencies need a unified, practical method that respects privacy while reflecting the messy reality of modern customer journeys.
Customer Journey Mapping—via Media Relational Networks—offers that path. It combines:
- The sequence sensitivity of MTA
- The cross-channel coverage of MMM
- The practicality of media-level data
As our case study shows, this approach not only delivers insights but also empowers marketers to tell a richer story about how media works together to drive growth.
At More Than Data, we see this as more than a methodology. It’s a mindset shift—one that allows marketers to move from siloed metrics to a unified, realistic view of how their investments shape the customer journey.
Ready to Learn More?
If you’d like to explore how customer journey mapping can transform your measurement strategy, visit More Than Data or read our blog series on real-world applications.
